 Jane Bunn - Jane's Weather
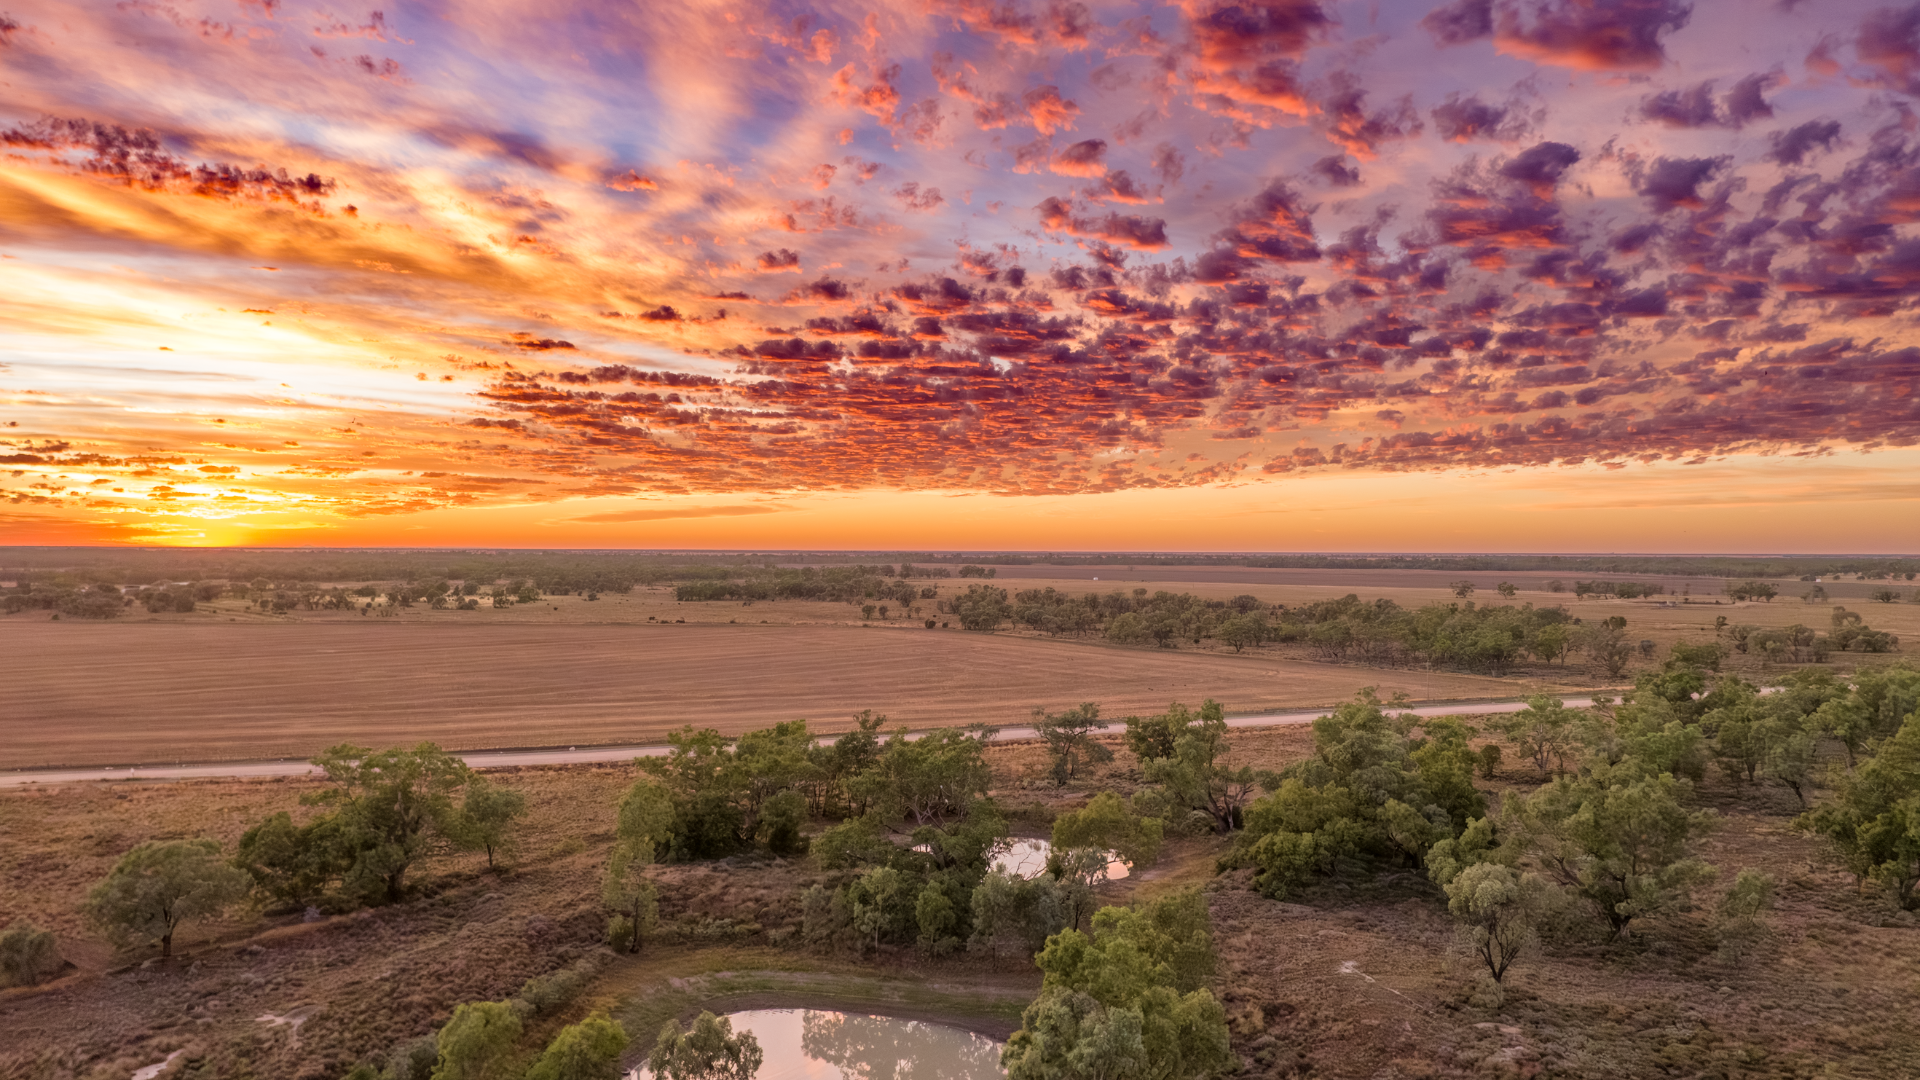
Frosts intensify and spring heat looms as El Nino signals build
Another quiet week of weather is on the way. The coverage and strength of the frontal weather is expected to be more of a feature for those exposed...

There is a fair bit of talk about El Nino not delivering as expected, and the potential for La Niña this year. Here I walk you through the observations and latest projections from several of the drivers that have an influence on our weather.
It’s good to reflect back and know that one driver doesn’t control them all, we shouldn’t focus on just one to determine the long term future. They all work together to ultimately determine what impacts us from day to day.
It’s important to note that these won’t tell you what is likely, specifically, at your place this season either. They just describe what is influencing the weather pattern. You can have all the moisture you like, but if the trough or low isn’t over your spot, it won’t rain. Or, you can be lacking moisture, but if that trough or low parks itself over your spot for a while, then yes it will rain and it will rain a lot.
Seasonal forecasting isn’t designed for major business decisions, as it’s the day by day weather that will ultimately impact conditions on your farm - but it is good to follow and monitor to be aware of what is driving us.
The Pacific Ocean has been in El Nino since mid 2023. This means that the Pacific Ocean has less moisture available for Australia.
The outlook shows all models expect neutral conditions for autumn and some of winter. There are two models currently suggesting La Nina is possible from June onwards. This means two out of six models have the potential for the Pacific Ocean to have extra moisture available for Australia. No models like a repeat of El Nino.
Keep in mind:
this is just one of the many drivers that give us a seasonal outlook
research has shown it is (unfortunately) least trustworthy over late summer and autumn
 The Pacific Ocean Index - the brown area shows El Nino, encouraging the Pacific Ocean to push moisture away from Australia. The green area shows La Nina, encouraging the Pacific Ocean to push moisture towards Australia.
The Indian Ocean has been in a Positive Indian Ocean Dipole (IOD) since mid 2023. This means that the Indian Ocean has less moisture available for Australia.
It has just returned to neutral with the monsoon arriving in Australia.
The outlook shows most models expect neutral conditions for autumn and some of winter, while two models suggest a weak Positive IOD is possible.
It is good to note that some of these models were recently forecasting a Negative IOD, but none of them like that anymore.
 Image: The Indian Ocean Index. The brown area shows a Positive Indian Ocean Dipole (IOD), encouraging the Indian Ocean to push moisture away from Australia. The green area shows a Negative IOD, encouraging the Indian Ocean to push moisture towards Australia.
Once we have the moisture let’s turn it into rain.
The Southern Annular Mode (SAM) was Positive from early December right through to late January.
This encouraged moisture from the incredibly warm Tasman Sea to run into troughs and lows and deliver heavy rain. This overrode the drying effects of El Nino.
SAM is currently taking a break — which is why it has stopped raining in southeastern Australia. See the 10 day outlook for the latest hour by hour forecast for your spot.
Unfortunately, forecasts for SAM always show neutral in the weeks ahead, so we can’t get a good handle on what the weather pattern is likely to feature.
This one is good at telling us why something occurred, not what is likely in the future.
 Image: The Southern Annular Mode (SAM). The top green section encourages troughs and lows in our weather pattern, while the bottom green section encourages strong cold fronts to penetrate further north into Australia. Troughs and lows generally bring more rain than cold fronts.
One more: the Madden Julian Oscillation (MJO).
This is a pulse of energy that travels around the tropics. It has been in Australia’s longitudes since early January. This encourages tropical activity in our north, and cyclones.
This increase in activity is likely to remain with us until around 10th February.

Image: The Madden-Julian Oscillation (MJO). When in the green zone, a pulse of energy is in our part of the world, indicating that the Australian tropics are likely to be active. This increases wet weather in the north, and the risk of Cyclones. It can also feed weather systems travelling across southern Australia if they line up.
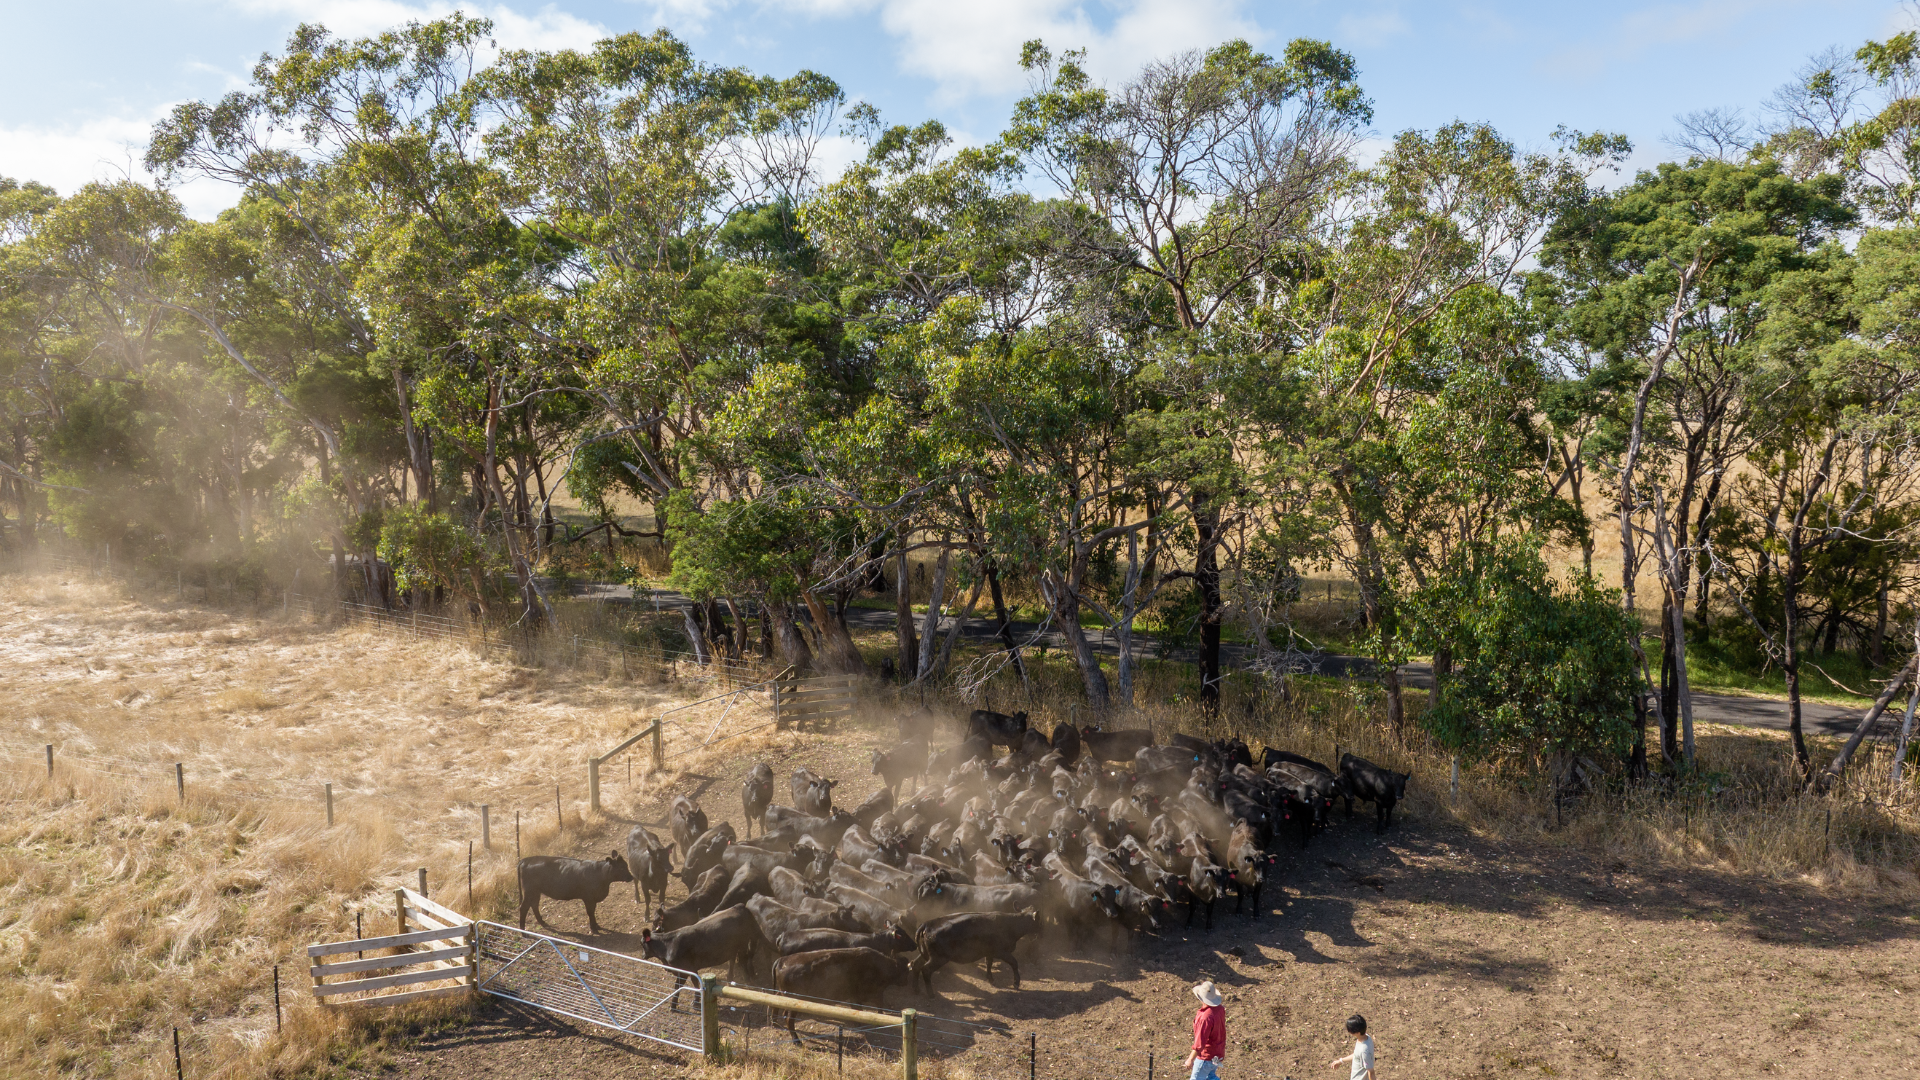
Another quiet week of weather is on the way. The coverage and strength of the frontal weather is expected to be more of a feature for those exposed...
The weather pattern is generally stable and with more high pressure on the horizon, this is indicative of the El Niño that is starting to influence...

A moderate cold front continues to slowly move through the southwest third of WA with moderate to heavy falls via thunderstorms along the coast and...