 Damien Thomson
China quota showing up in the data
Recent rain which has sent young cattle markets into overdrive have overshadowed some of the developing headwinds, especially for finished cattle....
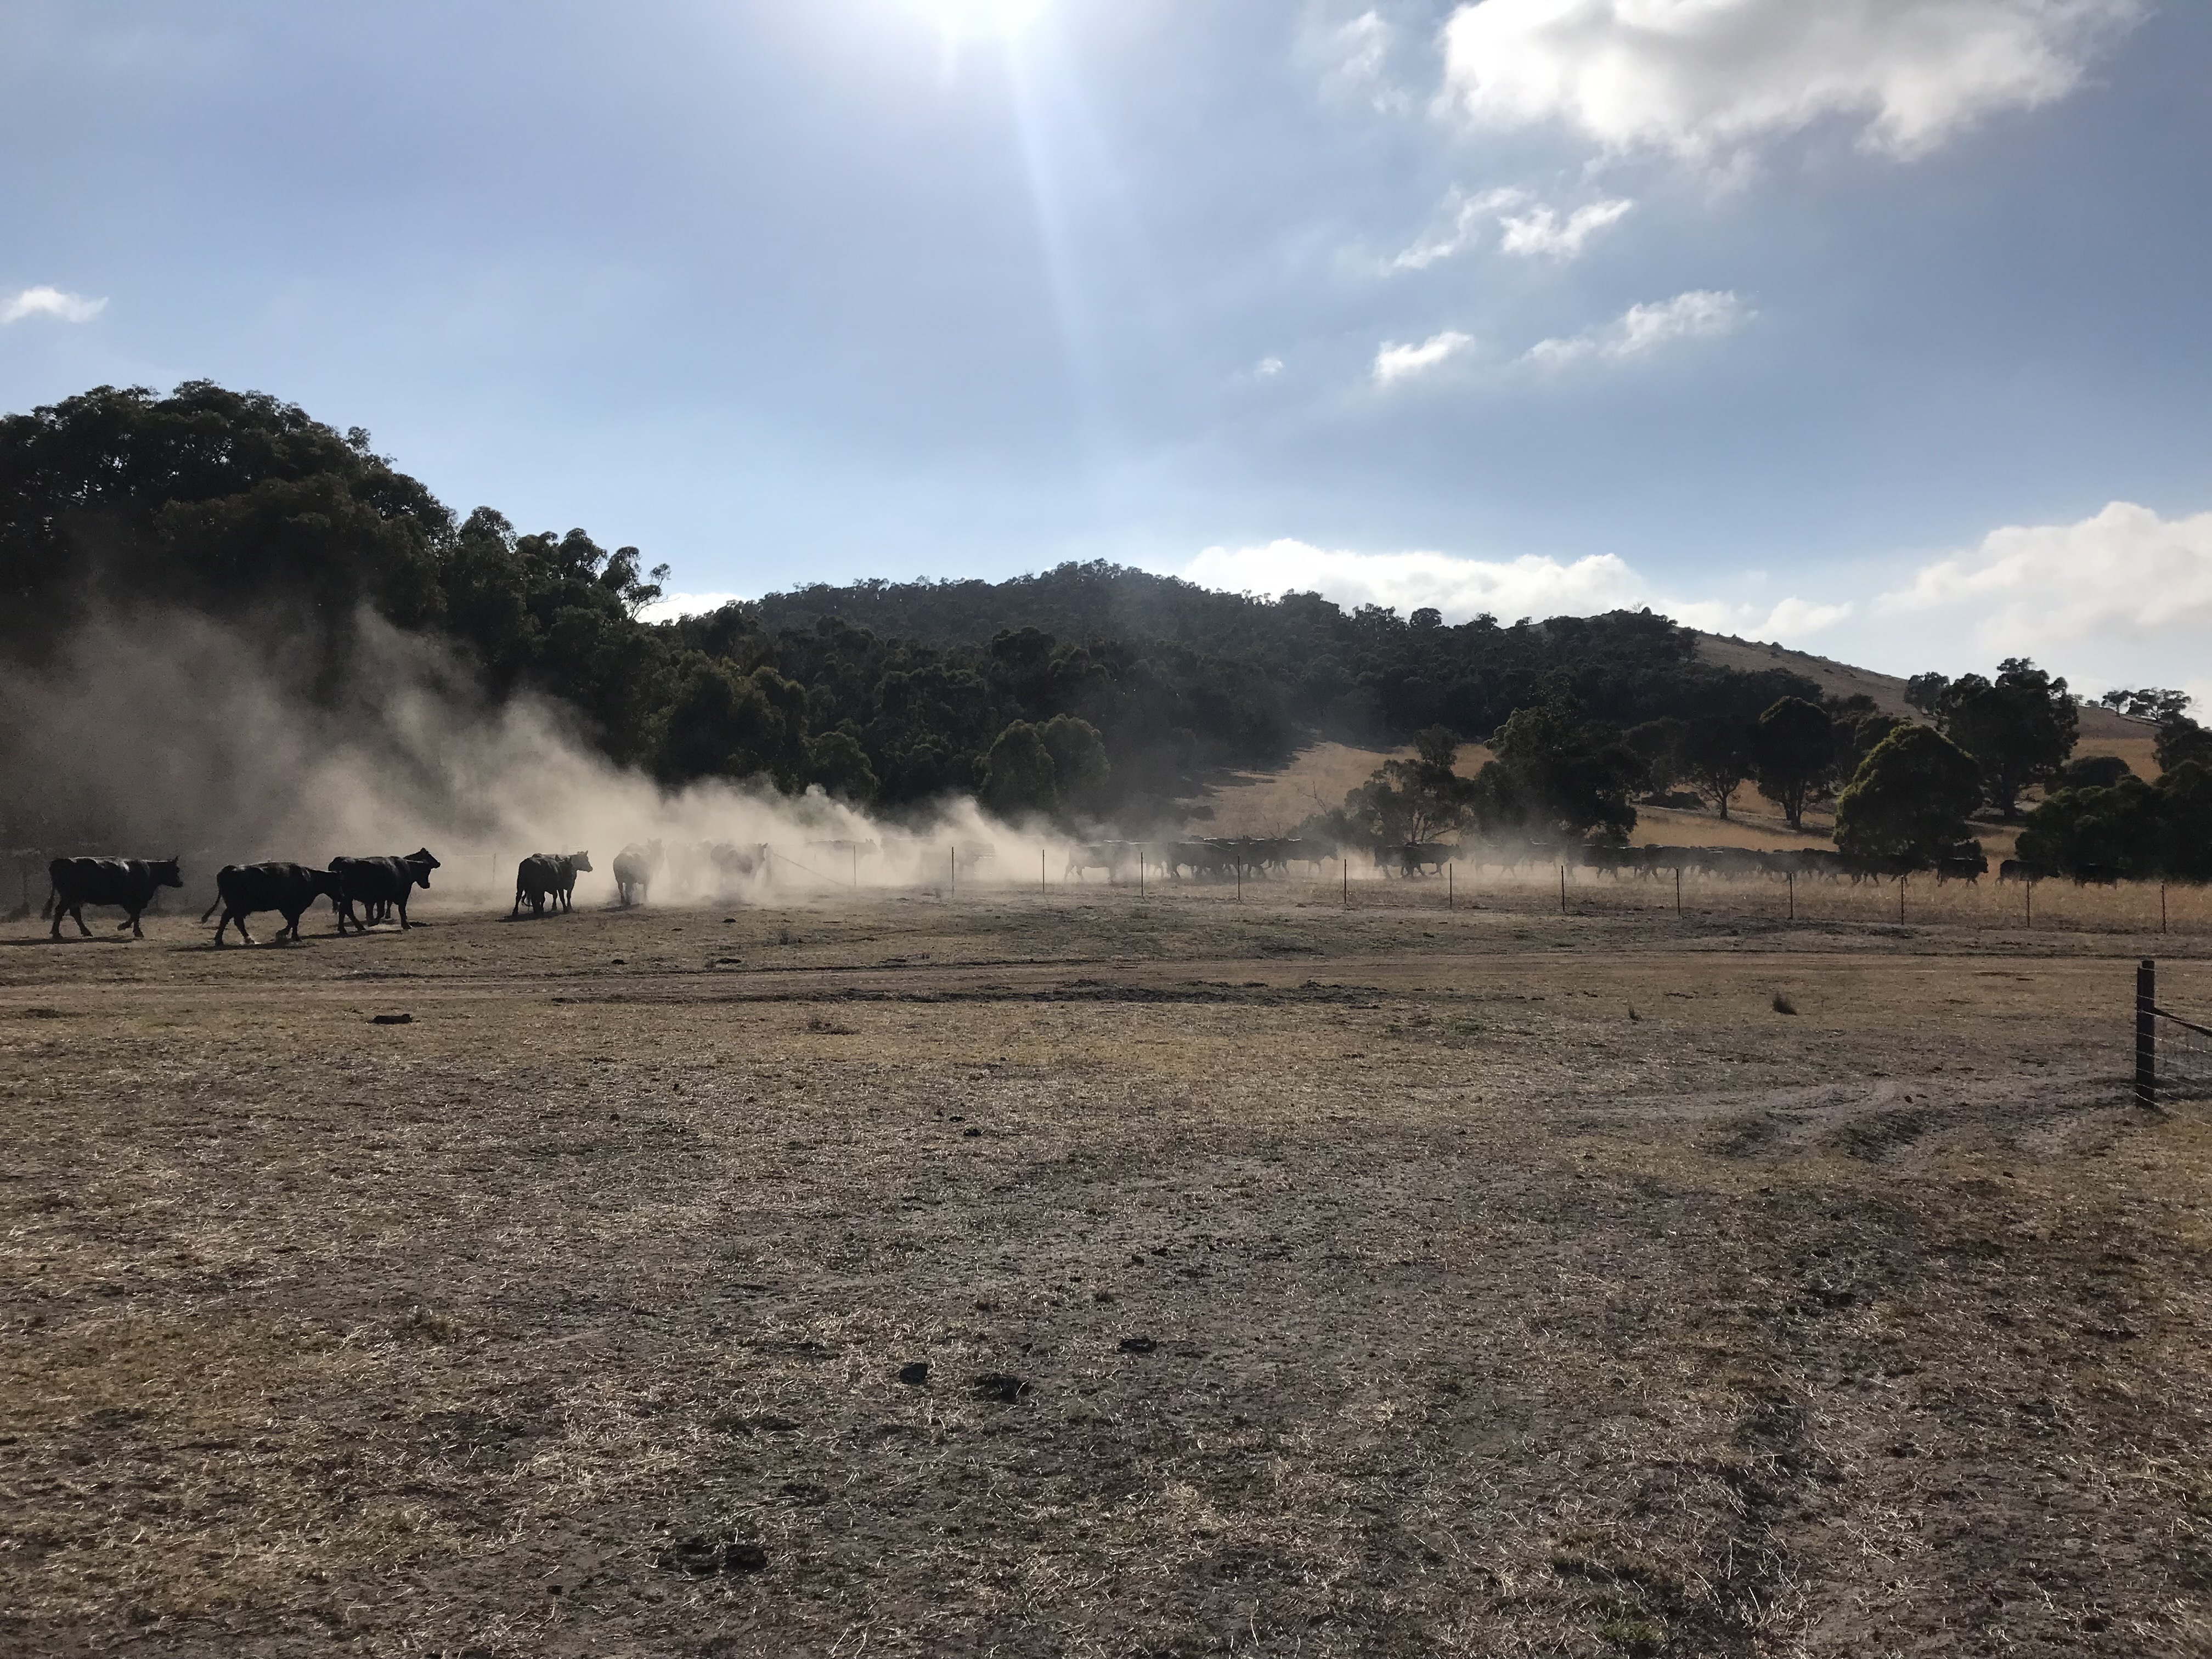
Seasonal conditions across Australia are extremely patchy at the moment. Some areas are enjoying a good spring while dry conditions are developing in other regions. It is important to keep a close eye on indications of soil moisture and pasture growth in your specific region as it may look vastly different to the national picture.
An El Nino means different conditions in different regions, and it is important to follow the regional indicators rather than get swept up in the rhetoric of global climate drivers.
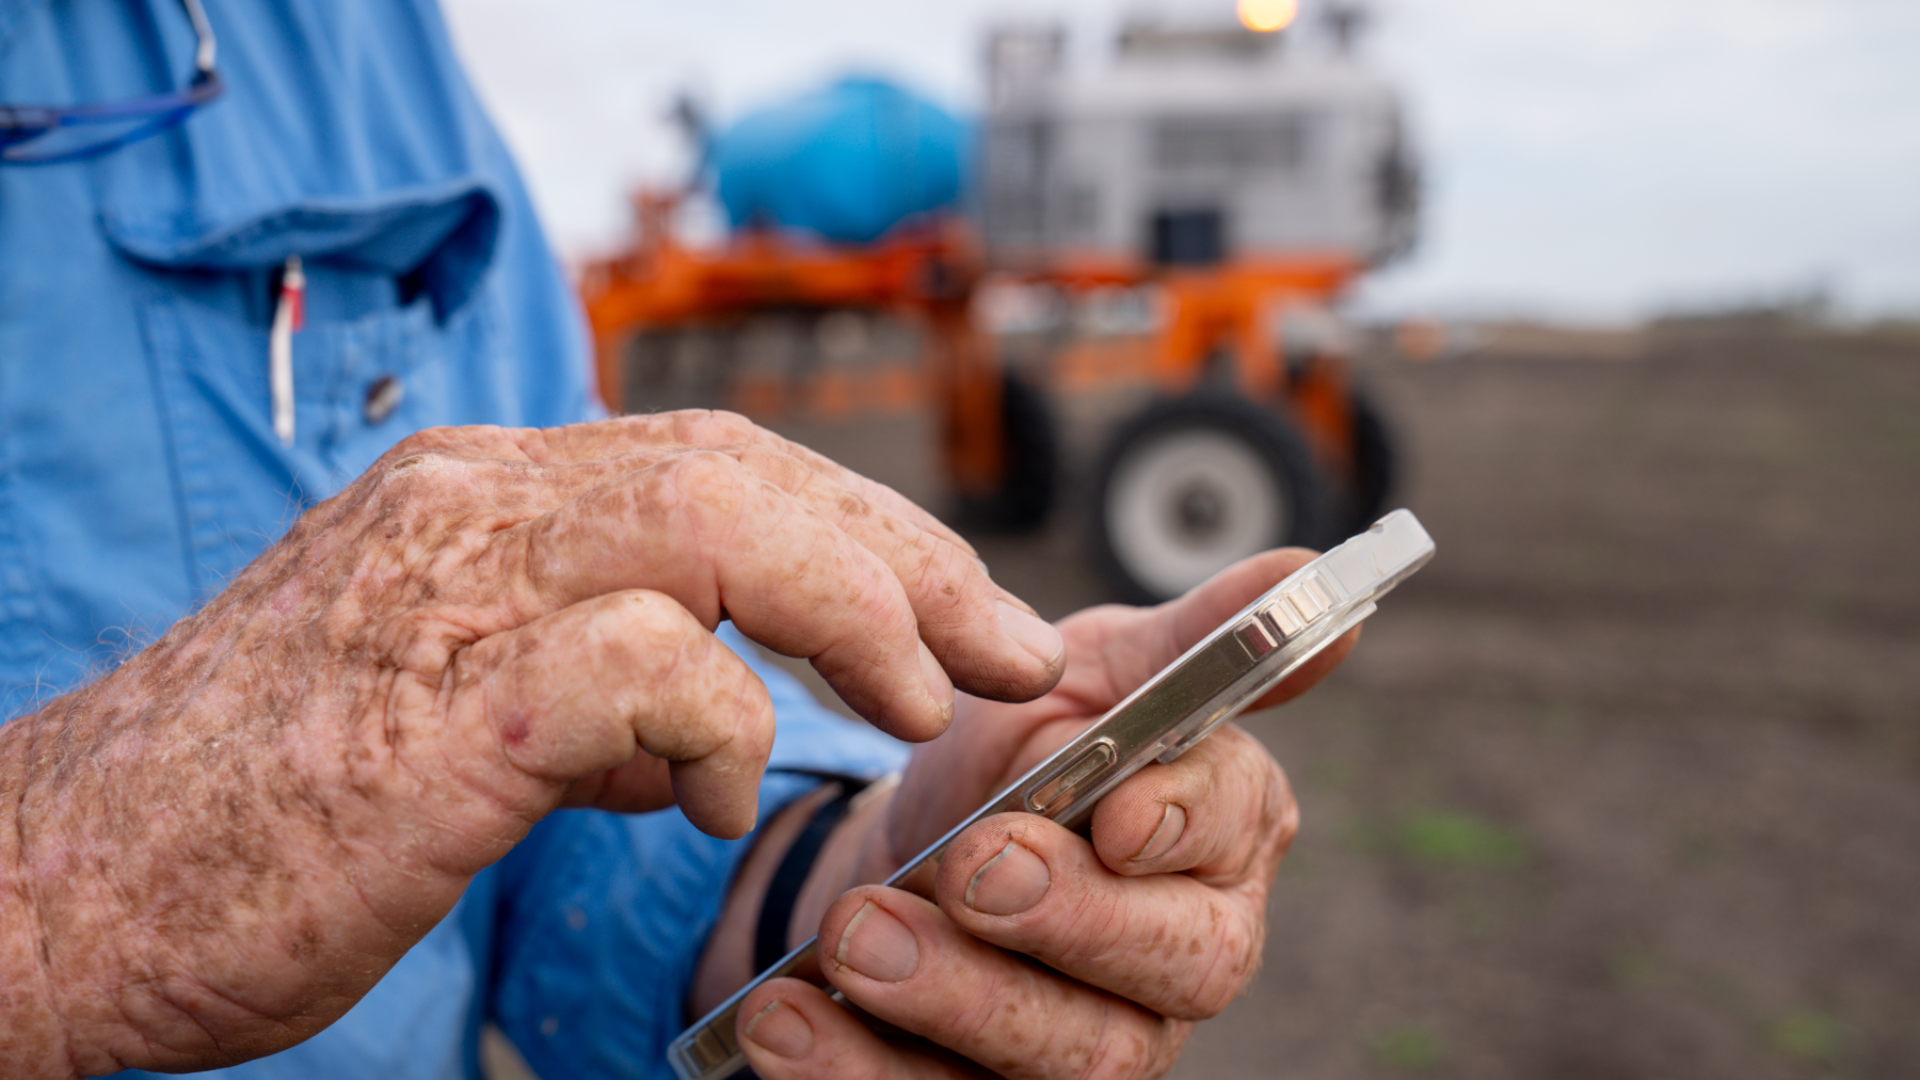
A more recent tool for drought notification and management is the Australian Feedbase Monitor thanks to MLA and Cibo Labs. This is freely accessible for MLA members with an LPA account via your MyMLA login. The tool provides data and trends in pasture growth and ground cover dating back to 2017. I have found it useful for my own family’s farm to compare pasture growth now to the same time in previous years.
Another very useful resource that I have drawn from for years is the ABARES Weekly Australian Climate, Water and Agricultural Update. This weekly update provides information across a range of agricultural commodities and industries. It includes a great summary of various commodity prices and draws climate information from the BOM but delivers and explains it in a way that is relevant and understandable for agriculture.
One that I have only come across more recently is the Farming Forecaster by NSW LLS. This tool draws on a network of soil probes and weather stations to deliver soil moisture and modelled pasture growth information. Importantly, it provides a modelled estimate of future pasture growth based on different percentiles of rainfall in the immediate future. This allows producers to determine how sensitive their pastures are to reduced rainfall before it happens.

The NSW Drought Hub by NSW DPI is also a major source of information and tools including the Combined Drought Indicator. This looks specifically at areas that are classified as varying levels of drought impact rather than rainfall or pasture growth generally.

There are many more drought indicators and resources available than the ones I have summarized here. If you have a useful resource that you would like to share, please feel free to send through to hkennedy@auctionsplus.com.au and we can share them with the wider AuctionsPlus community.
This is unfortunately my last article for AuctionsPlus as I am moving on to a new opportunity. It has been a real pleasure to bring the best possible insights to your inbox each week. I have always had the approach of what my own farming family needs and wants to know about the market and industry, and I hope you have found it valuable in your own agribusinesses. Thank you for your interest, engagement and feedback, and I wish you all the best.

Recent rain which has sent young cattle markets into overdrive have overshadowed some of the developing headwinds, especially for finished cattle....
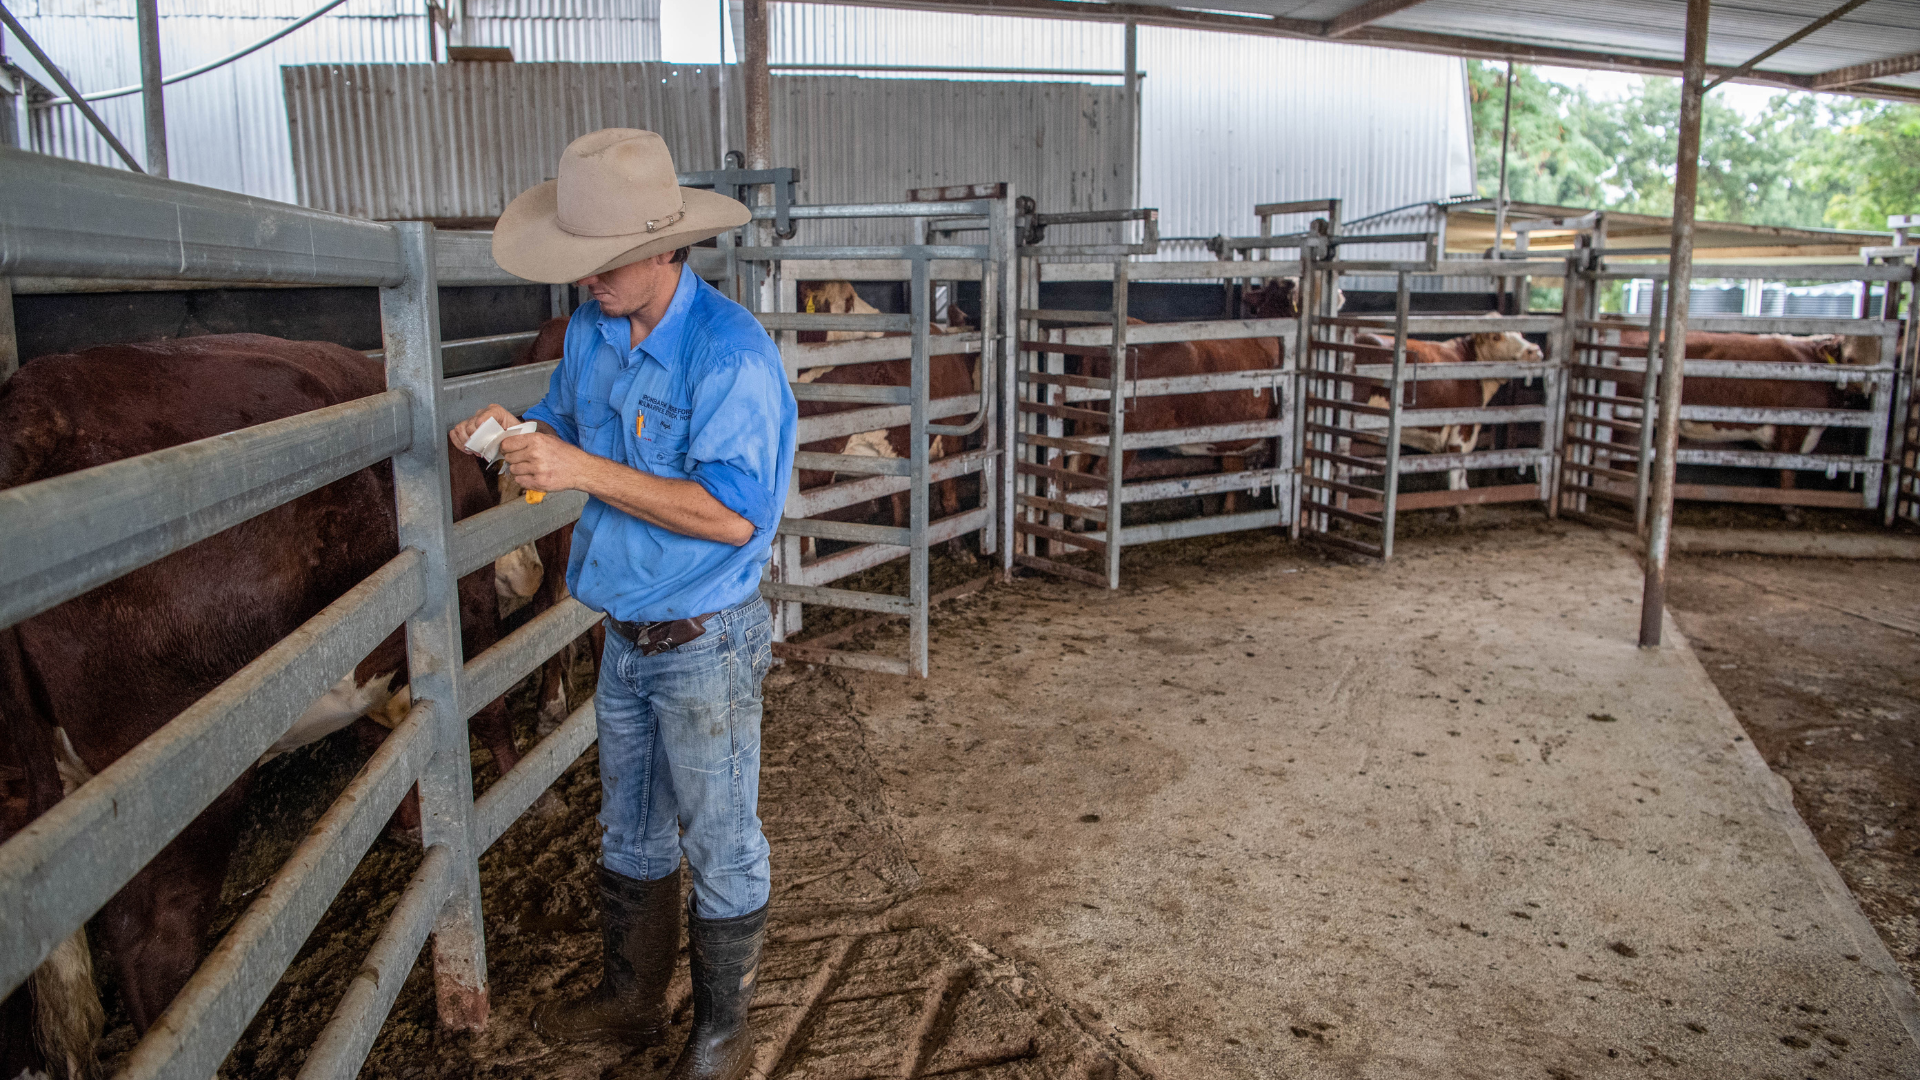
The national Beef Producer Intentions Survey (BPIS) results published by Meat & Livestock Australia show that Australia’s breeding female cattle herd...
Every story we publish, every market wrap and weather update, is written with one audience in mind: you.