


Do El Niño declarations really impact cattle markets?
4:18

The Bureau of Meteorology (BOM) has declared that an El Niño weather pattern had formed. 

Historically, El Niño has had close associations with drought, notably The Millenium Drought and the 2015 drought. This can negatively impact producer sentiment and seasonal expectations.  

However, it’s important to note that all El Niño events are different and conditions for producers are highly variable. For example, due to late spring rain for most of the country, the September 2023 El Niño declaration returned a relatively mild impact for producers.  

El Niño events are typically associated with drier and warmer conditions across parts of eastern and northern Australia. However, as it was noted in 2023, these impacts are probabilistic rather than guaranteed.

Last week, due to recent widespread rains markets seemingly ignored the El Niño declaration, with most cattle indicators lifting between 4% for the Restocker Yearling Steer Indicator and dropping 1% for the Heavy Steer Indicator.

Do weather readings hold long-term significance against cattle prices?

Several readings are used by BOM to determine an El Niño or La Niña pattern. Two key readings are the Southern Oscillation Index, which measures the difference in sea level pressure between Tahiti and Darwin and the Niño3.4 index, which measures changes in sea temperature between the International Date Line and the coast of South America.

Data going back to 2000, however, shows that these key readings hold no statistical significance in relation to cattle prices. Below is a table of the correlation coefficients between the Southern Oscillation Index and Niño3.4 and the National Young Cattle Indicator and Heavy Steer Indicator.


Monthly averages used for indicators with monthly readings used for observations – January 2000 to May 2026. Source: MLA, BOM.

For a relationship to be considered statistically significant between two variables, it must be at least greater than 0.3 (for positive correlation) or less than -0.3 (for negative correlation). Anything between these values means no relationship exists. When examining the relationship between the NYCI and Heavy Steer Indicators and the Southern Oscillation Index and Nino3.4, none of the variables holds a statistically significant relationship.

How has the NYCI previously responded to the El Niño/La Niña cycle?

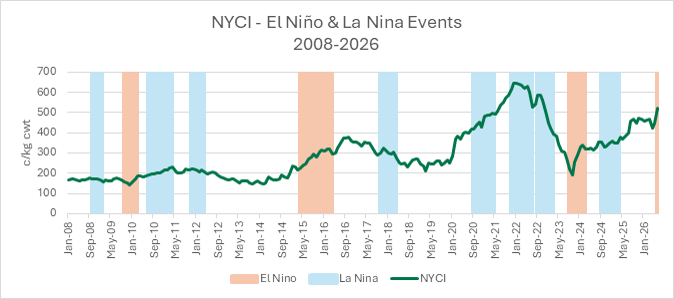
The graph below tracks the NYCI since 2008, with El Niño and La Niña cycles called out against the indicator.


Source: MLA, BOM

As the earlier correlation coefficients suggest, there is no discernible relationship between the indicator’s movement and the BOM’s declarations of El Niño and La Niña. Instead, the indicator has a closer relationship with general supply dynamics.

Supply dynamics and the cattle cycle the dominant market driver

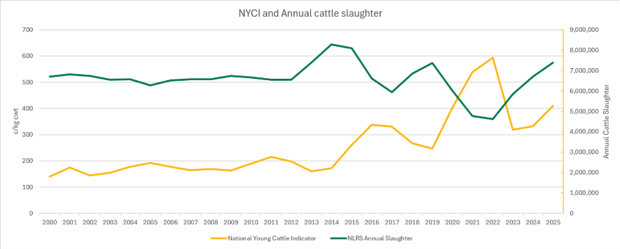
Since 2000, a much stronger relationship has manifested between the NYCI and annual cattle slaughter.


Annual averages used for Indicators with annual NLRS slaughter report numbers used for cattle slaughter from 2000 to 2025. Source: NLRS, MLA

The reading above shows a moderate negative relationship between the NYCI and cattle slaughter, meaning that as slaughter increases, the NYCI tends to fall. A similar but weaker relationship is shown to exist for the Heavy Steer Indicator, reflecting the influence that supply, often driven by seasonal conditions, has traditionally had on price.


Annual average used for NYCI against annual figures for NLRS slaughter report. Source: NLRS, MLA

Despite sustained high slaughter in 2026, the NYCI has continued to strengthen. This indicates that current market dynamics are being driven less by domestic supply pressure and more by demand. Tight global cattle supplies, strong export demand and Australia’s ability to maintain consistent product delivery have supported prices.


The Bottom Line

  • BOM’s official El Niño declaration hasn’t spooked buyers.
  • There is no long-term relationship between El Niño declarations and cattle prices.
Record prices headline strong new season lamb run

Record prices headline strong new season lamb run

New season lamb prices have hit an all-time high for the January to August period, averaging $229.14 a head across all categories on AuctionsPlus, a...

Read More >
Mutton volume and price ratios

Mutton volume and price ratios

Sheep meat prices are trading at high levels anyway they are presented, with mutton well and truly holding its own. This article takes a look at...

Read More >
Slaughter resets 50-year highs as beef production breaks new records

Slaughter resets 50-year highs as beef production breaks new records

Today, the Australian Bureau of Statistics (ABS) released the Quarter 2 2026 slaughter and production numbers for red meat and livestock.

Read More >