 Damien Thomson
Records tumble in AuctionsPlus sheep and lamb sales
There's no secret the sheep and lamb markets are firing, but it's record prices achieved on AuctionsPlus in recent weeks that have got tongues...
AuctionsPlus commercial cattle listings are up over the previous quarter but down for the year. See what regions are buying and selling.
Key Points:
Southern Queensland listings fell 11%, giving the lead to NSW Northern Tablelands
Trading activity booms in the NSW’s Monaro, South Coast and Southern Tablelands
Listings rise and clearance rates stabilise as vendors adjust to new price levels
AuctionsPlus commercial cattle offerings for the second quarter of 2023 (1st April – 30th June) totalled 173,556 head – a 10% rise from the previous quarter but down 27% from the same quarter in 2022.
Prices have continued to decline at a similar pace to the previous quarter due to an increasing supply of slaughter cattle. Meanwhile, restocker demand has remained subdued due to higher herd numbers.
The combination of lower prices and good pasture availability is leading to greater retention of livestock on farm.
The EYCI started the quarter at around 680c and slid 120c over the quarter to finish at 560c/kg cwt at the end of June. However, clearance rates on AuctionsPlus were stable quarter-on-quarter to average 60%.
Steer numbers increased in the place of heifers across the quarter, lifting from 33% to 36%. Heifer numbers on the other hand slipped from 24% to 21%. This is consistent with multiple industry reports of significant retention of young heifers, particularly throughout Queensland.
Breeding stock accounted for 41% which was stable on last quarter, while mixed sex lines and bulls made up the remaining 2%.
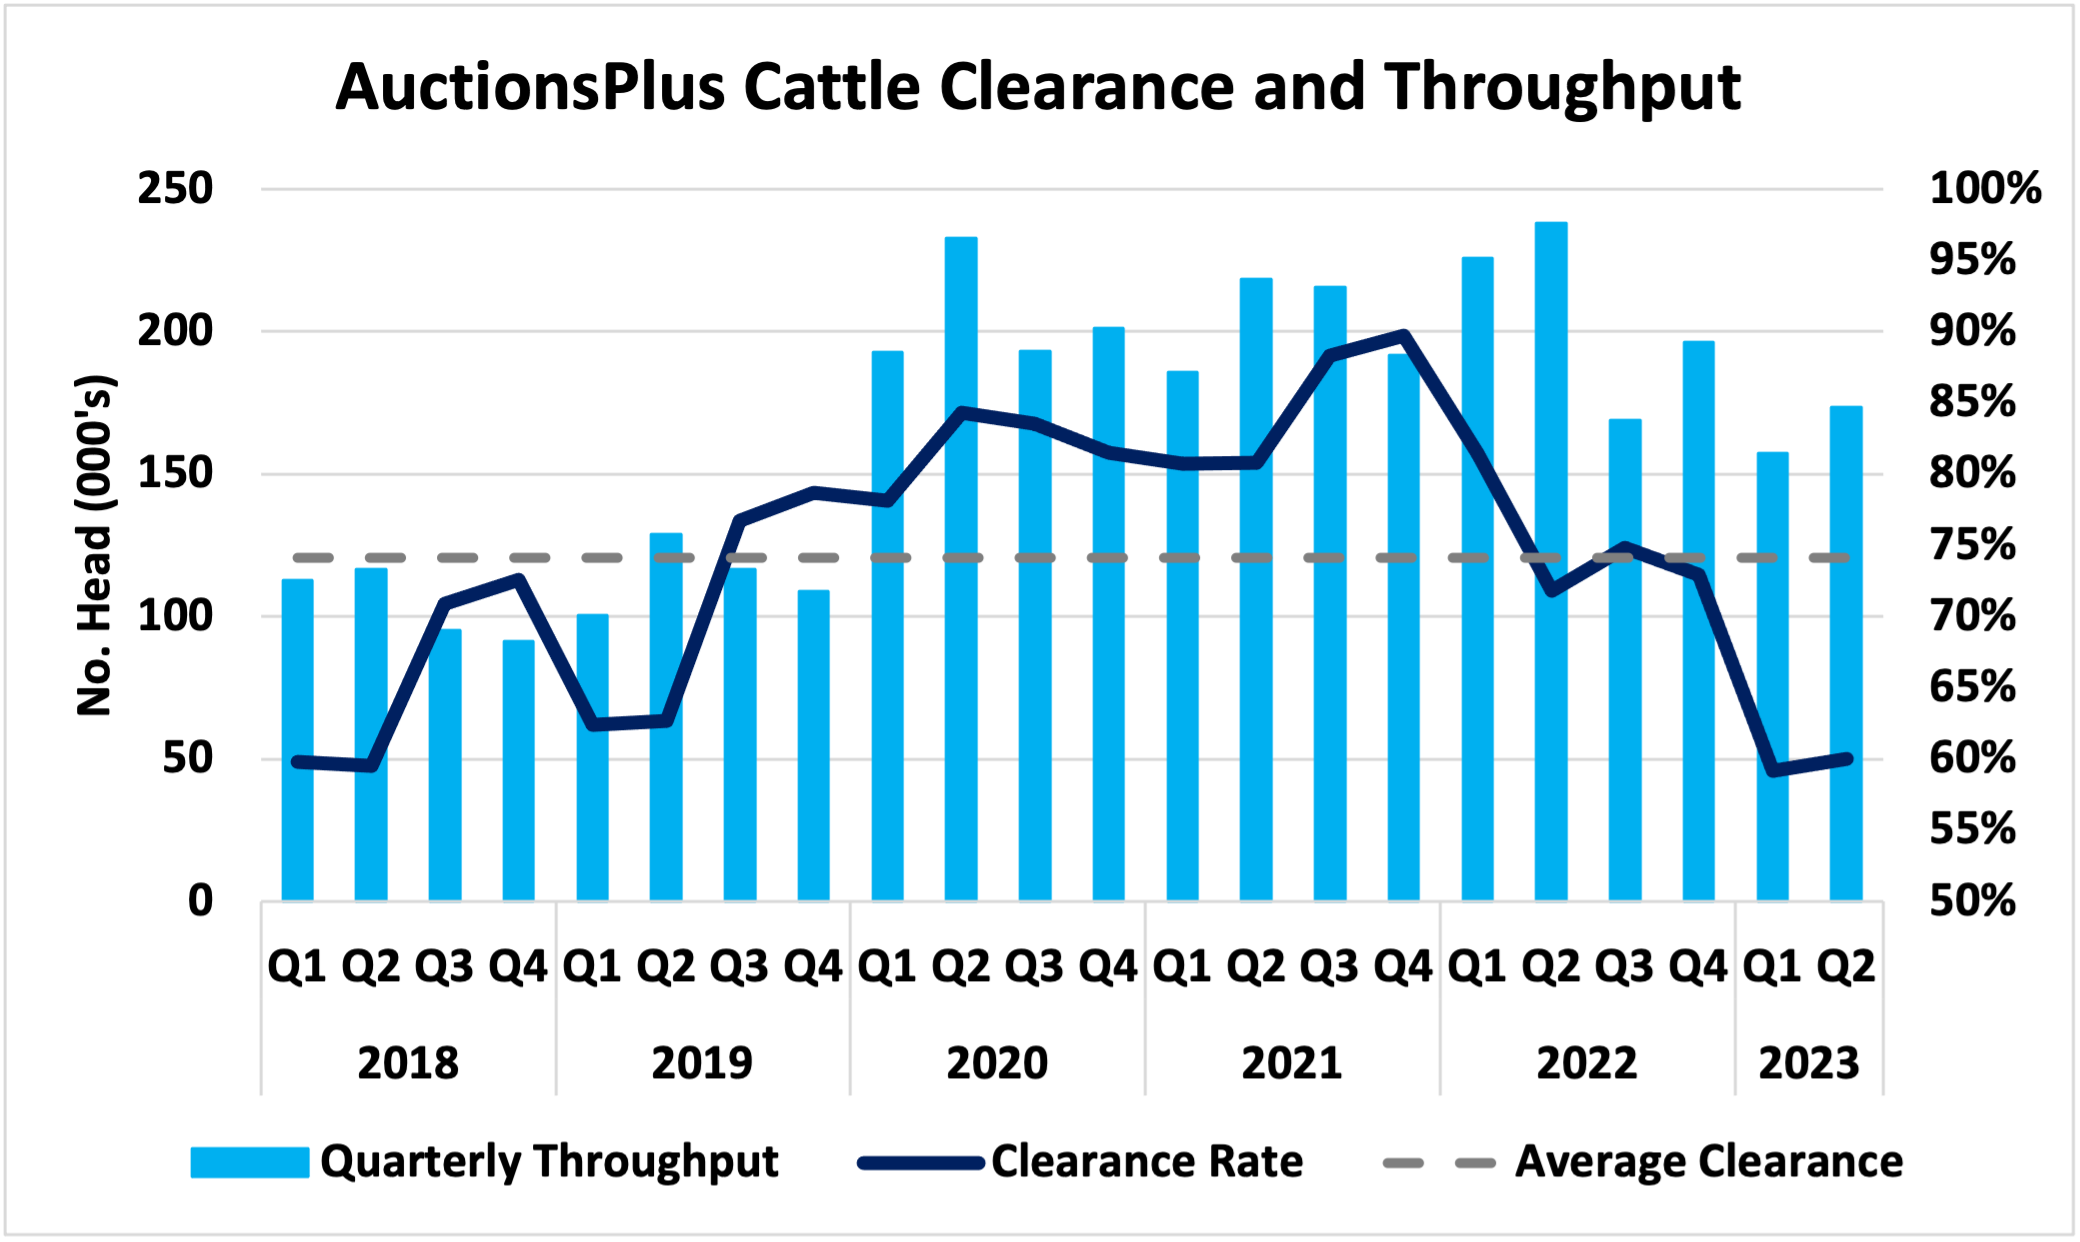
Figure 1: AuctionsPlus quarterly cattle clearance rates and throughput, 2018 – Q2 2023
NSW Tablelands listings on the up
The top ten regions for the quarter in Table 1 outline that the NSW Northern Tablelands has taken over the top spot, while Southern Queensland has fallen to levels not seen in three years.
The 23,245 head which secured the lead was 31% higher than last quarter, but 24% below the same quarter of 2022.
The NSW Central West rose to second place with 20,897 head – a 26% increase from the previous quarter and stable with the corresponding quarter of last year.
The NSW Northwest Slopes and Plains narrowly secured a podium finish with 19,482 head – 7% higher than last quarter, however, down 10% from the same quarter in the previous year.
Across the top ten listing regions, the NSW Hunter again recorded a year-on-year increase in listings – up 7% from Q2 2022 and up 9% from last quarter, while the NSW Monaro, South Coast and Southern Tablelands region also increased by 23% YOY with a massive 81% rise on the previous quarter.
| Rank |
State |
Listing Region |
No. Head |
Quarterly Change (%) |
Yearly Change (%) |
Clearance Rate (%) |
| 1 |
NSW |
Northern Tablelands |
23,245 |
31% |
-24% |
59% |
| 2 |
NSW |
Central West |
20,897 |
26% |
-1% |
47% |
| 3 |
NSW |
NW Slopes & Plains |
19,483 |
7% |
-10% |
59% |
| 4 |
QLD |
Southern Queensland |
19,150 |
-11% |
-42% |
61% |
| 5 |
NSW |
Monaro, South Coast, Southern Tablelands |
11,519 |
81% |
23% |
57% |
| 6 |
NSW |
Riverina NSW |
11,377 |
40% |
-15% |
60% |
| 7 |
QLD |
Western Queensland |
11,097 |
39% |
-38% |
60% |
| 8 |
NSW |
Hunter NSW |
9,050 |
9% |
7% |
72% |
| 9 |
VIC |
Northern Victoria |
7,732 |
1% |
-25% |
53% |
| 10 |
VIC |
SW Victoria |
6,806 |
-23% |
-50% |
54% |
Table 1: Top AuctionsPlus throughput regions for Q2 2023 and clearance rates
Sth Queensland brings the purchasing power
Purchases in the top ten regions on AuctionsPlus move in line with listings due to consistent clearance rates between quarters.
Table 2 outlines that Southern Queensland regained the mantle as top purchasing region with 19,623 head – up 2% from last quarter, however, down 55% from a year ago.
NSW Northwest Slopes and Plains again took out second place with 11,820 head purchased – up 45% from last quarter, however, 32% lower than last year.
The NSW Riverina stepped up into third place with 10,288 head purchased – up 21% from last year.
| Rank |
State |
Purchasing Region |
No. Head |
Quarterly Change (%) |
Yearly Change (%) |
| 1 |
QLD |
Southern Queensland |
19,623 |
2% |
-55% |
| 2 |
NSW |
NW Slopes & Plains |
11,820 |
45% |
-32% |
| 3 |
NSW |
Riverina NSW |
10,288 |
21% |
-9% |
| 4 |
NSW |
Central West |
8,568 |
-2% |
-57% |
| 5 |
NSW |
Northern Tablelands |
6,317 |
33% |
-33% |
| 6 |
VIC |
Northern Victoria |
6,100 |
31% |
-26% |
| 7 |
VIC |
SW Victoria |
4,984 |
95% |
23% |
| 8 |
QLD |
Western Queensland |
4,591 |
-13% |
-47% |
| 9 |
NSW |
Monaro, South Coast, Southern Tablelands |
4,043 |
21% |
-41% |
| 10 |
QLD |
Central Queensland |
3,842 |
-4% |
-52% |
Table 2: Top ten AuctionsPlus purchasing regions for Q2 2023
The proportion of AuctionsPlus listings in all states except NSW slipped lower from Q1 2023 to Q2 2023 (Figure 2).
NSW’s proportion of listings increased from 51% to 60% in Q2 2023, while Queensland slipped from 22% to 21%.
Victoria accounted for 13%, with SA and Tasmania making up 3% each.
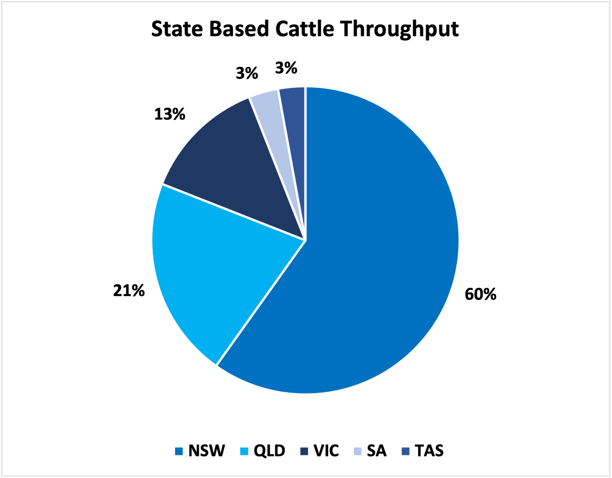
Figure 2: Q2 2023 AuctionsPlus cattle listings by state 2022.
As always, if you have any questions or suggestions, feel free to email me at dthomson@auctionsplus.com.au

There's no secret the sheep and lamb markets are firing, but it's record prices achieved on AuctionsPlus in recent weeks that have got tongues...
The global beef market discussion was focussed primarily on the United States for much of the past few years - until China made headlines with new...
The set up is complete - now all signs point towards a central eastern Australia rebuild shaping the market come Spring 2026.