 Jane Bunn - Jane's Weather
Spring preview for some as weather changes
A moderate cold front continues to slowly move through the southwest third of WA with moderate to heavy falls via thunderstorms along the coast and...
The 2023-24 El Nino in the Pacific came to an end this week as the ocean slowly undergoes a big shift, and it will take some time to enter the next phase: La Nina. The Indian Ocean is in a Positive phase, and likely to remain that way for several months.
We look at the Pacific and Indian Oceans to see what sources of moisture we’ll have at our disposal in the months ahead.
The Pacific is most likely to transition into sending moisture our way in winter or spring.
The Indian Ocean is most likely to limit our moisture in autumn and winter, then potentially shift into sending us moisture in spring.
In order to make it rain you need two things to work together - moisture and instability (low pressure).
The following charts tell us about the moisture part of that equation. Unfortunately, the instability part is much more of a mystery in the long term.
The ocean is the main source of our moisture, and our weather is heavily influenced by the state of the oceans in the tropics.
In the Pacific, this latest El Nino was strong, but had less effect on Australia thanks to two things: a lack of cooling of the waters off Queensland, and an incredibly warm Tasman Sea. They offset the usual effects of El Nino.
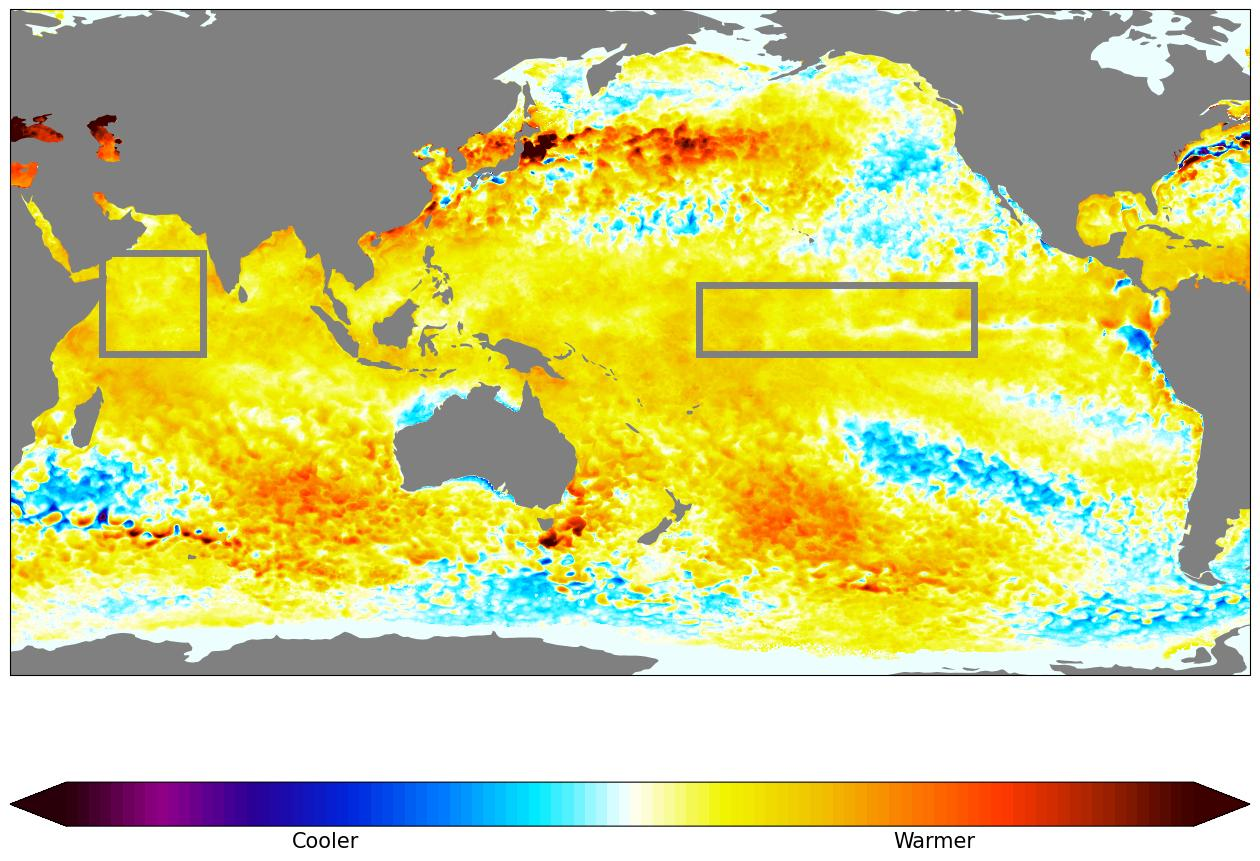
The Pacific box is still warmer than average - but it is much less red than it was in summer, and there is a hint of blue appearing - more so than last month. This is the ocean transitioning out of El Nino and heading towards La Nina.
Over in the Indian Ocean the box is also warmer than average. A Positive Indian Ocean Dipole (IOD). But do note that it’s also doing what the Pacific did in El Nino - there is no corresponding blue patch off western Indonesia.
Sea surface temperature anomaly.
That slowly growing blue in the eastern Pacific has a much bigger area of blue under the surface.
Watch how an area of blue has grown and strengthened, aiming for the eastern Pacific.
This is the kicker, the instigator of change. That blue will slowly spread across the surface, turning the Pacific box cooler than average.
Below the surface.
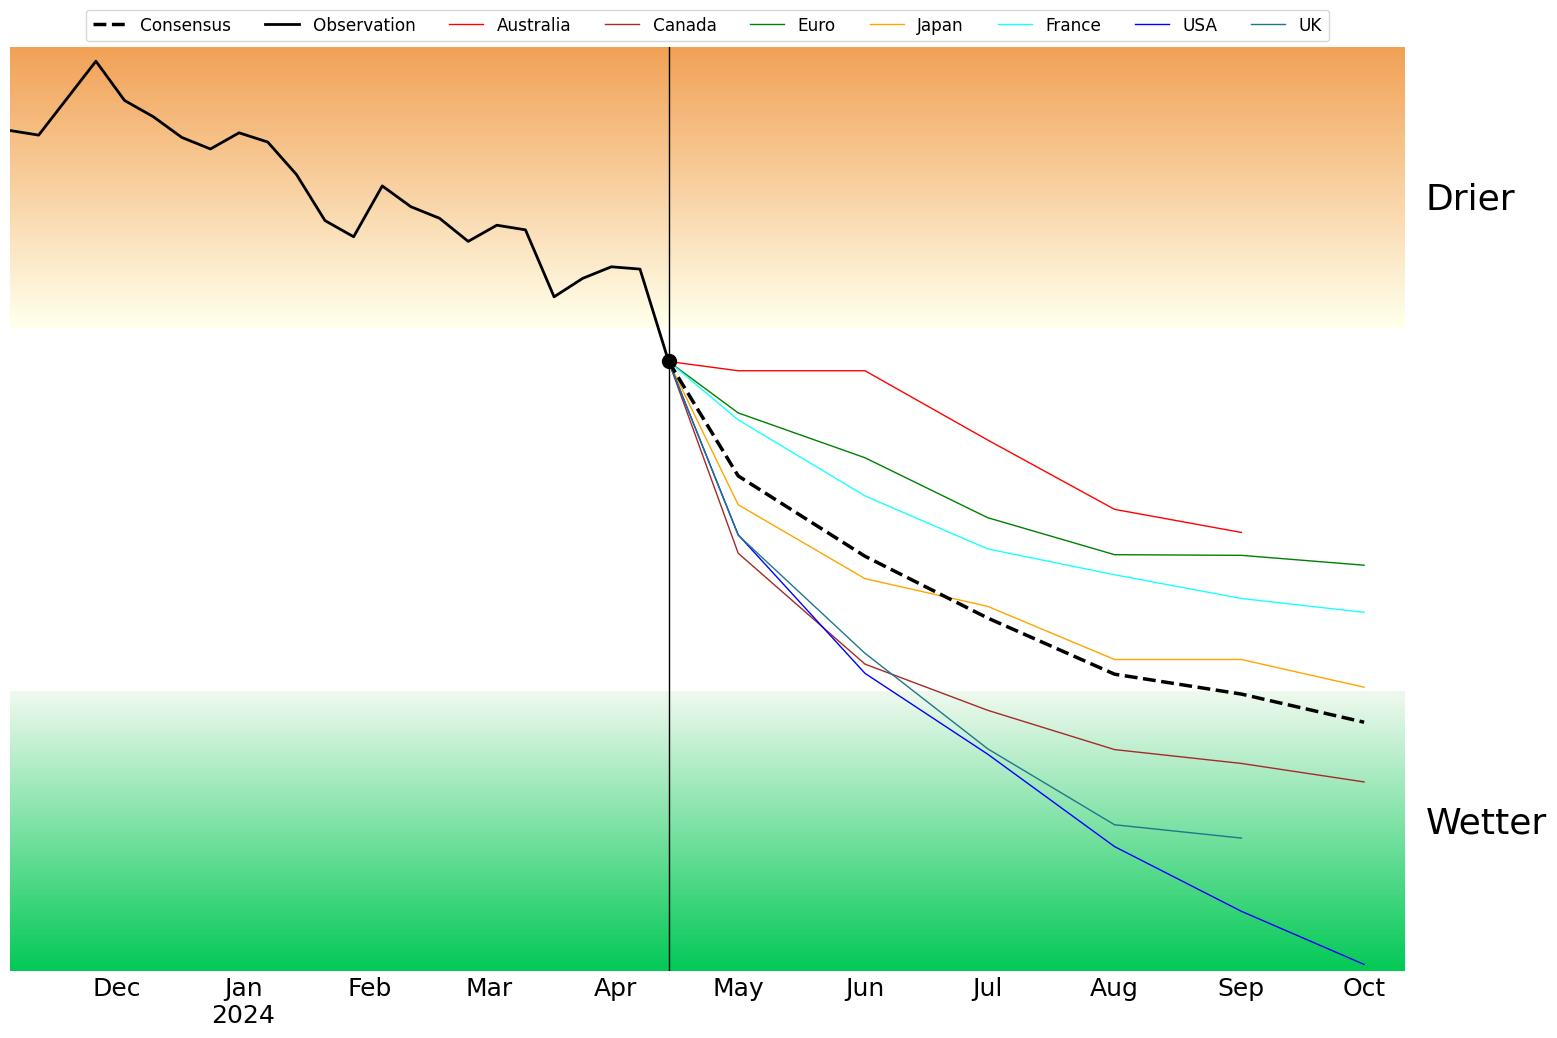
Here we see the strong El Nino (black line in the brown zone) coming to an end with a swift transition to neutral (the white zone) as we go through autumn.
This week we crossed the threshold back into neutral.
All international models project the temperature in that box to cool in the months ahead.
Three models have us crossing into La Nina (the green zone) in July, another waits until October, and the remaining three remain in neutral through the forecast period.
This is on top of the already warm water off QLD, and the incredibly warmer than average Tasman Sea.
Key point: We’re most likely to have a good source of moisture (from the east) from mid winter onwards.
The Pacific Ocean.
The Indian Ocean is telling a different story.
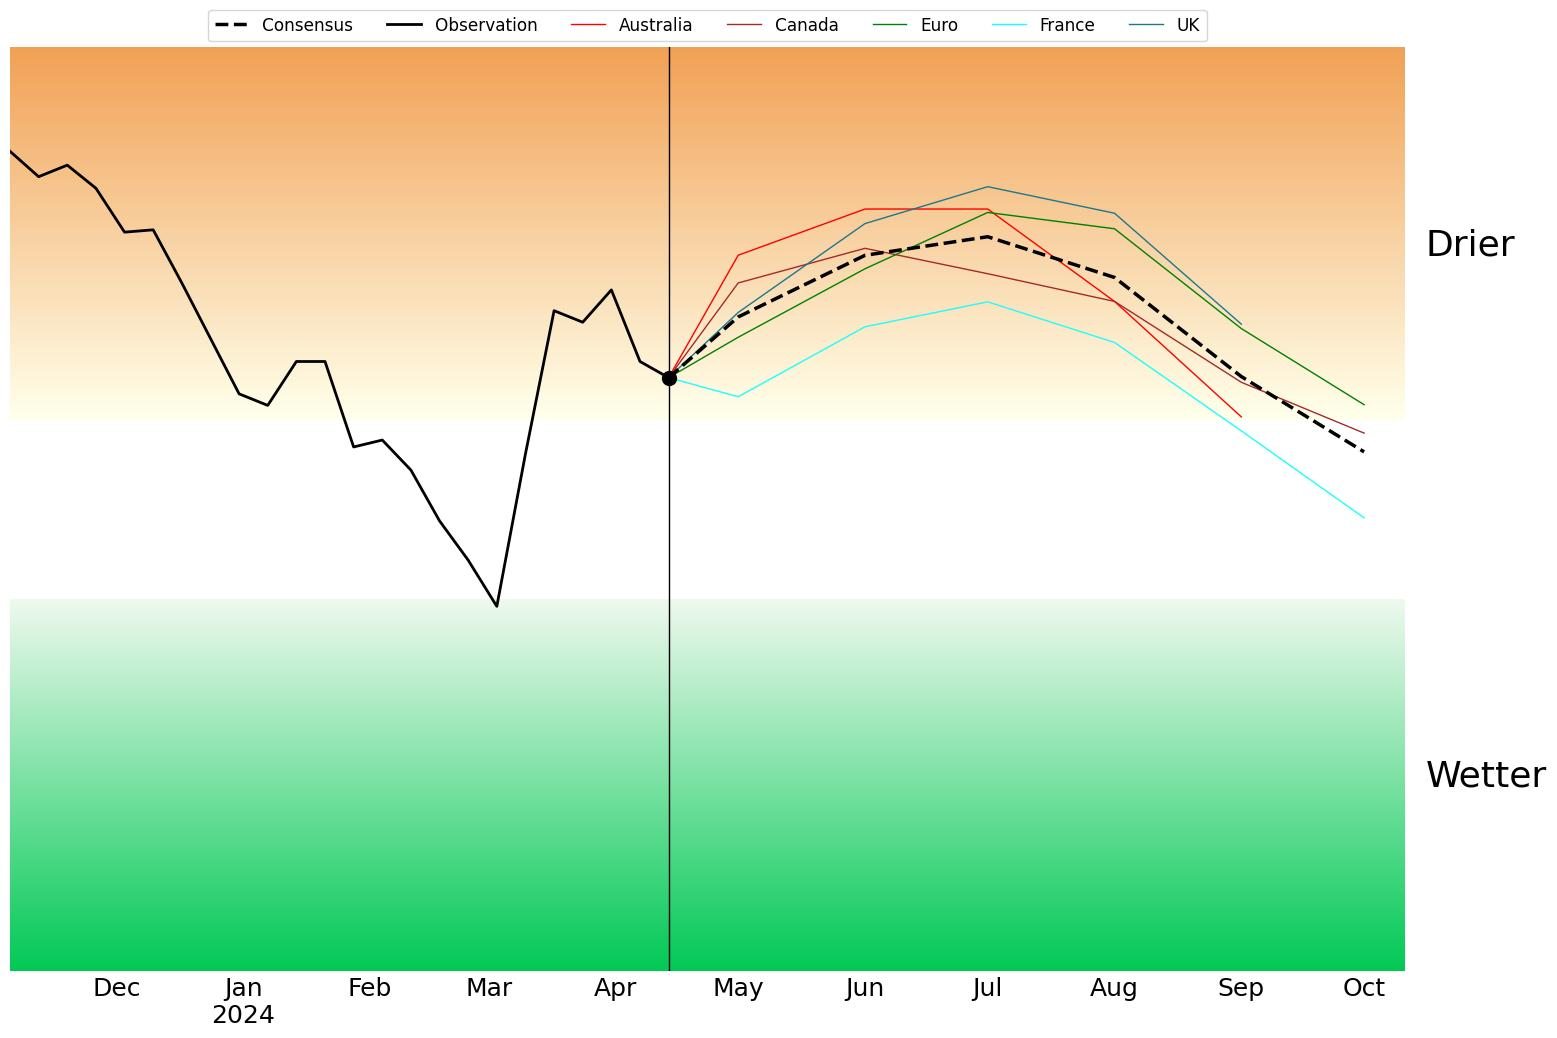
The brief dip in March was just the monsoon in action as it does every summer.
Now we are in continuous Positive anomalies and it is half way through autumn so that is starting to mean something.
The forecast from each and every model indicates a Positive IOD as we go through the rest of autumn and winter.
That pushes moisture away from Australia, making those juicy northwest cloud bands that bring rain to the south less likely, or at least less juicy.
However, just like in the Pacific during the last El Nino there is no corresponding blue patch, which means there is no Dipole. This means what we traditionally know as a drying effect, may not be a strong as in the past.
Also, the trend across the models is a downwards trajectory in spring. That is something to watch.
Key point: This forecast in years gone by would mean the Indian Ocean didn’t send us moisture, but the lack of blue offset could offset that lack of moisture. Also, the Indian Ocean could undergo change as we head through spring.
The Indian Ocean.
Putting all of that together, we look at a blend of the weather models, and see the odds for above or below average rain.
These outlooks take into account our sources of moisture, but are limited in knowing what low pressure will do with that. Ultimately, we have a good idea of how much moisture we will have to play with, but a hazy idea of what will turn that into rain - and an even hazier idea of where those weather systems will move.
Overall, it all depends on where the low pressure moves as to who has a good season.
The outlooks show a drying trend in May (except for Queensland), quickly jumping into a wetter trend from June.
BoM’s seasonal forecast isn’t included in the blended product, so I’ve shown their forecast separately.
The blend of weather models.
BoM’s outlook.

Jane’s Weather provides hyper local weather forecasting based on the consensus of all the weather models, using Machine Learning and AI to calibrate the forecast to conditions at your farm.
We include updates on temperature, rain and wind, along with evapotranspiration for efficient water usage, frost risk, growing degree days and a detailed spraying forecast customised for any property in Australia.

A moderate cold front continues to slowly move through the southwest third of WA with moderate to heavy falls via thunderstorms along the coast and...
A quiet weather pattern continues for much of the country this week with ridging in place over much of the continent and only the northern tip of...

It is a quiet weather week across the country, with a new large high moving into place, this leading to settled conditions this weekend and next...