 Jane Bunn - Jane's Weather
Frosts intensify and spring heat looms as El Nino signals build
Another quiet week of weather is on the way. The coverage and strength of the frontal weather is expected to be more of a feature for those exposed...
There is a little rain for the southeast from Saturday to Monday, ahead of the next bigger system: in the west on Sunday/Monday, then in the southeast from Tuesday to Friday. Then there are good signs for rain in week 2 (beginning July 14), as the Indian Ocean continues to shift, heading towards a Negative IOD.
As the East Coast Low moves away, a new system has crossed the west and heads for the southeast this Saturday to Monday.
This is also a low, but it has very different characteristics to the last, powerful one. The last one had pressure just above 980hPa, this one remains above 1000hPa.
The last one had heavy rain and flooding, powerful winds and coastal impacts, this one just brings a light bit of rain.
The next system is more interesting.
Crossing the southwest on Sunday into Monday, arriving in the southeast on Tuesday. Followed by a stronger cold front in the southeast, with a burst of properly cold air on Wednesday/Thursday next week.
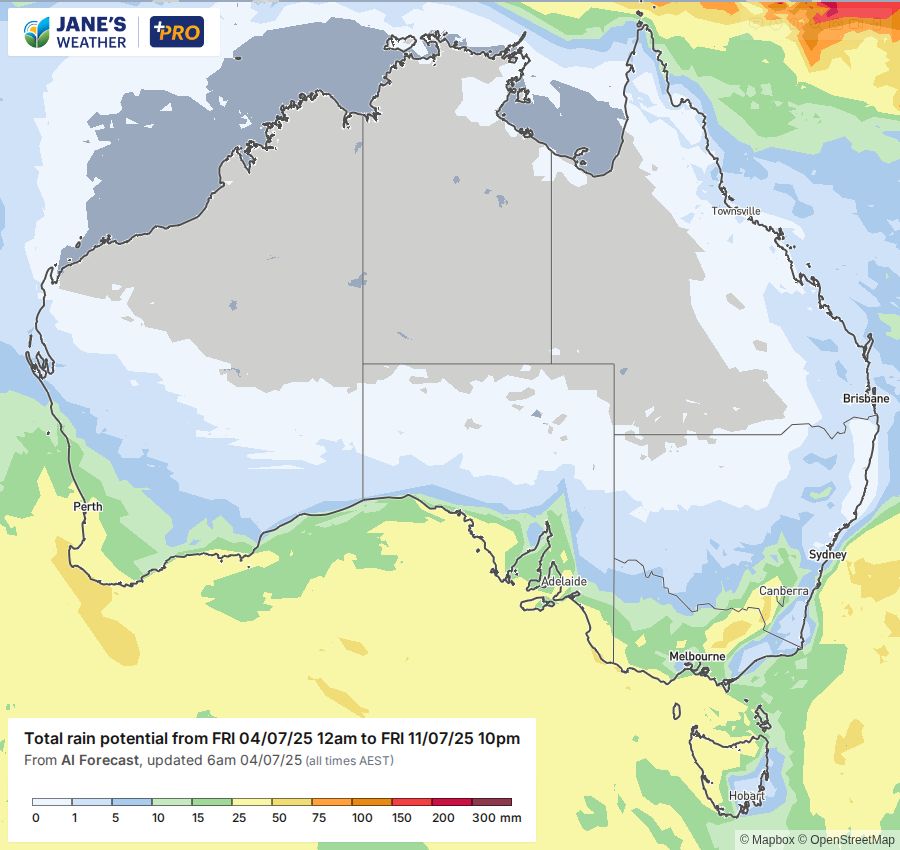
This pattern ensures that both the southwest and the southeast have rainfall ranges of 25 to 50 mm (all the yellow's on this map). That's for the southwest up to Perth; coastal and adjacent parts of SA; the southwest and ranges of Victoria; and the north and west of Tasmania. The falls then decrease as you head inland/east/the other side of the ranges - so that the hardest hit by the last system ... Gippsland and eastern NSW ... miss out on this one.
Potential rainfall over the next week.
As we head into next weekend there may be a big system brewing in the west. This could be the beginning of what we are seeing as the overall pattern for 'week 2' (beginning Monday July 14). We like it when multiple models are singing the same tune ... and here we have both the Euro and the Australian showing above average rain across much of the south in this period.
Potential rainfall anomaly in week 2: beginning Monday 14th July - from the Euro model and BoM model.
In order to make it rain we need moisture and instability to work together.
Tropical air holds a lot more moisture than colder air over the Southern Ocean, and when the oceans are warmer than usual there is even more moisture to play with.
The Pacific Ocean is having a neutral year, not helping us one way or the other - but we have a large pool of warmer than average water off Queensland, so we have our own local source (seen in action in the recent rainfall over Queensland, and from the East Coast Low).
The Indian Ocean is undergoing change, with deep blues and purples developing in the box in the west. The atmosphere doesn't like imbalances, and these changes in the ocean will drive the atmosphere to actively push moisture from the Indian Ocean towards Australia.
This is known as a Negative Indian Ocean Dipole (IOD) - the ‘La Nina of the Indian Ocean’ - and while the forecasts for its strength have reduced, it's still great to see the ocean actively moving in this direction.

For a full update on all these graphs and charts, don't miss this week's video update:

Jane’s Weather provides hyper local weather forecasting based on the consensus of all the weather models, using Machine Learning and AI to calibrate the forecast to conditions at your farm. We include updates on temperature, rain and wind, along with evapotranspiration for efficient water usage, frost risk, growing degree days and a detailed spraying forecast customised for any property in Australia.
Another quiet week of weather is on the way. The coverage and strength of the frontal weather is expected to be more of a feature for those exposed...
The weather pattern is generally stable and with more high pressure on the horizon, this is indicative of the El Niño that is starting to influence...

A moderate cold front continues to slowly move through the southwest third of WA with moderate to heavy falls via thunderstorms along the coast and...