 Jane Bunn - Jane's Weather
Spring preview for some as weather changes
A moderate cold front continues to slowly move through the southwest third of WA with moderate to heavy falls via thunderstorms along the coast and...
Over the next week and a half we’re likely to be stuck in a persistent pattern where the rain falls over the west and far north of the nation, and the rest miss out. That’s according to every one of the different weather models that make up the guidance for what is most likely to occur day by day, hour by hour at your specific location.
But an alternative forecast from the BOM tells a very different story, where increased rain is shown crossing the interior of the country and spreading down into the southeast across NSW.
What gives?
Let’s start with the traditional modelling and compare it with BOM’s chart below.
This guidance has rainfalls well over 100mm in parts of Western Australia that are typically very dry at this time of year - and you’ll notice a similar pattern from each weather model, giving us higher confidence in the outlook.
The northern rain is caused by a new wave of the MJO (Madden Julian Oscillation) that is currently visiting Australia and encouraging tropical activity. The western rain is thanks to stubborn low pressure, dragging that tropical moisture down into the western states - but mostly missing the far southwest on the ‘dry’ side of the low pressure.
Some models have a bit of rain coming into the southeast later in the period, but not all show this feature, so confidence is low.
Below is the output from the Wednesday morning run of each weather model - ACCESS from BoM, GFS from USA, GEM from Canada and ECMWF “the Euro” from Europe - for total potential rain from today through to the end of next week.
Image: Potential rain from each of the weather models, from Wednesday 6th March to Friday 15th March
Now I want to show you another type of map, another potential outcome.
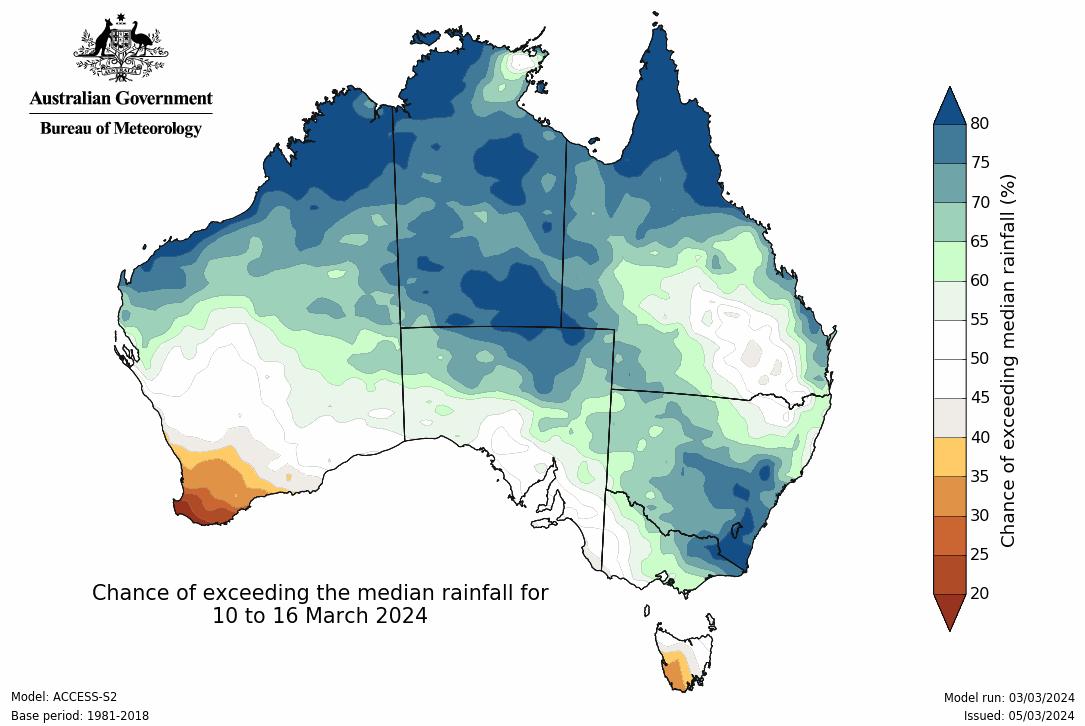
This is one of the products that the Bureau provides to show longer term rainfall trends, also from the ACCESS model, but a seasonal version of that data. It’s the first in their long term product suite, looking at just next week. Other maps in the suite look at week 2 and the months and seasons ahead.
Image: The BoM’s chance of exceeding median rainfall from Sunday 10th March to Saturday 16th March
This map shows departure from the median (similar to average), rather than absolute totals like the previous maps - and it indicates a very different weather pattern next week across Australia.
You will notice the tongue of increased rain is shown as crossing the interior of the country and spreading down into the southeast across NSW.
This is not indicated at all in the previous maps.
So, can the BoM’s long range product be trusted?
I’m looking forward to seeing how conditions actually turn out as we head through next week.

A moderate cold front continues to slowly move through the southwest third of WA with moderate to heavy falls via thunderstorms along the coast and...

A quiet weather pattern continues for much of the country this week with ridging in place over much of the continent and only the northern tip of...

It is a quiet weather week across the country, with a new large high moving into place, this leading to settled conditions this weekend and next...