The southern Australian fire season has been very quiet so far in the southeast, as one would expect in a La Nina summer, while in the less La Nina affected southwest bushfires have burned.
After months and months of above average rain, there has now been above average grass growth.
As we head through the summer months, and with a return to longer dry stretches in parts of the southeast, all that excess grass is drying out.
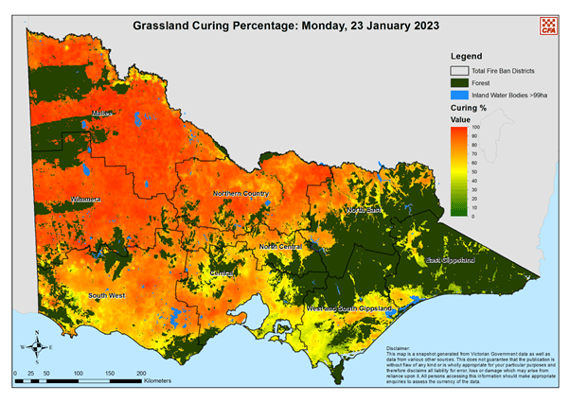
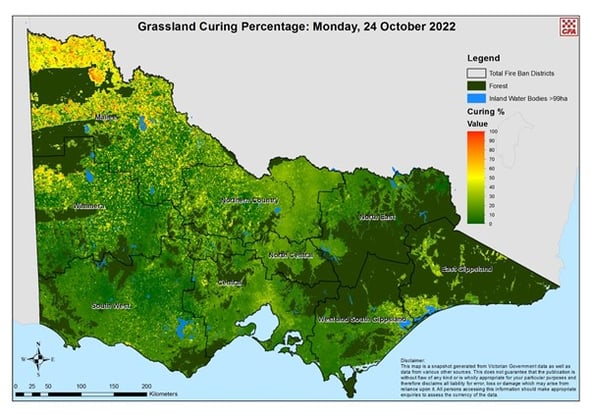
The following maps are just for Victoria, but are representative of much of southeastern Australia… and they show just how much the landscape has changed over the past three months:
 Above: current Grassland Curing Percentage map showing how dry the grass is across much of Victoria.
 Above: the Curing Percentage from three months ago.
If we have the combination of something triggering a fire, and a strong cold front moving through, then grass fires are an increased concern for the rest of the fire season. The season may linger well into April, especially with a weaker and delayed autumn break (thanks to a shift in the global weather patterns towards a positive Indian Ocean Dipole and El Nino, the opposite of what we’ve seen for the past three years).
We continue to experience a very active period in the tropics, usual for this time of year, and enhanced by the lingering La Nina. A cyclone is possible off the northwest coast.
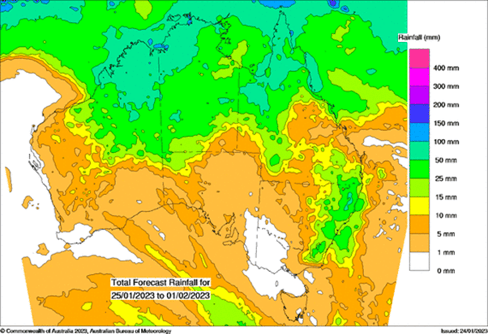
The rainfall projections show that some of that tropical rain is likely to dip down into the south from time to time… but only in a small way for southern WA, SA, VIC, TAS and western NSW.
Southern QLD along with central and eastern NSW are more likely to see a greater impact from this rain dipping down:
 Above: Projected rainfall for the next 8 days.
The weather models indicate that a lot of this activity will be in the form of showers and thunderstorms. These are ‘hit and miss’, ‘start and stop’ - so they affect one property and miss the next - rather than widespread rain that affects a large area and persists for a long time.
That means that these projections should be read as a risk map. They show which areas are at risk of thunderstorms, not everywhere that will actually see one. Head to the daily rainfall outlook and hour by hour forecasts at Jane’s Weather to see on which days and hours they are a risk at your place.
Sign up for alerts at Jane’s Weather below to stay ahead of what rain is on its way.
Our alerts cover the overall weather forecast, plus: rain and snow, frost risk, good spraying conditions, hot and cold temperatures, heat stress and wind chill, and more, tailored to any property in Australia.
 Results

