El Nino and a positive Indian Ocean Dipole (IOD) are both on the cusp of beginning. This encourages drier than average weather (overall) for the second half of 2023, across much of Australia.
Pacific Ocean
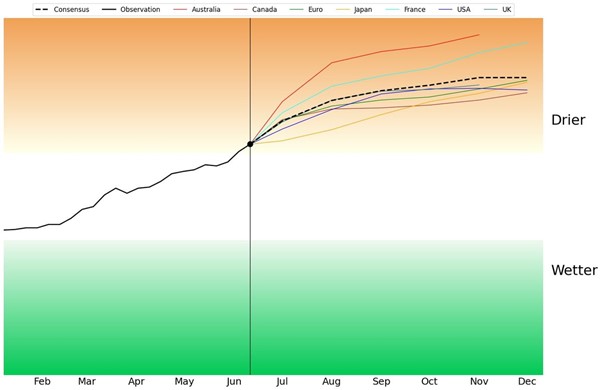
 Above: Pacific Ocean: the black line is the observation, the coloured lines are the forecasts from the different weather models, with the consensus of these shown in black dashes.
Latest observations show that we crossed the Pacific Ocean’s brown zone threshold in early June.
This indicates that a large pool of warmer than average water is located far away from Australia, in the central and eastern part of the tropical Pacific.
Forecasts show that we will remain in the brown zone for the rest of the year, lasting into at least early 2024.
When we are in the brown zone, the Pacific Ocean is in a positive phase, given the name: El Nino.
The Bureau announces an El Nino when we have been in the brown zone for three months, so when you finally hear the news from them it is an observation rather than a forecast. They have us in ‘El Nino Alert’ status before this, to indicate that it is highly likely to occur.
Indian Ocean
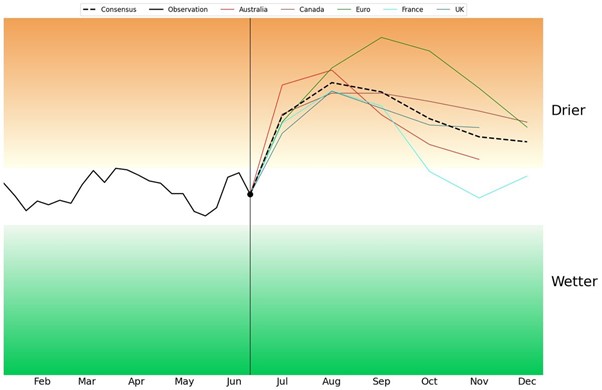
 Above: Indian Ocean: the black line is the observation, the coloured lines are the forecasts from the different weather models, with the consensus of these shown in black dashes.
Latest observations show that we have come close to crossing the Indian Ocean’s brown zone threshold twice this year, in April and again in early June.
The latest observation has it falling away, but you can see how quickly it can rise back up - and all forecasts show that we should be in the brown zone from July through to October. This ocean naturally goes into neutral over summer thanks to the monsoon.
The brown zone indicates that a large pool of warmer than average water is located far away from Australia, in the northwestern part of the tropical Indian Ocean.
When we are in the brown zone, the Indian Ocean is in a positive phase, but this ocean doesn’t have a fancy name, it's just called: Positive Indian Ocean Dipole (positive IOD).
Sea surface temperature anomaly

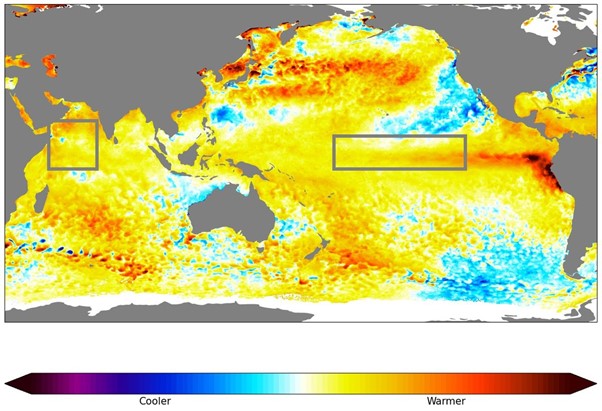
Above: Sea Surface Temperature Anomaly: how much warmer or cooler the surface of the ocean is. Tropical oceans push a huge amount of moisture into the air above them, and differences from average can lead to a big shift in which areas see that moisture, and which areas dry up.
The sea surface map shows us these shifts in action.
The Pacific Ocean box now holds all warmer than average water, and the Indian Ocean box is fairly complete too.
However, in order to get the atmosphere following suit, and introducing the effects of these phenomena, we need the warmer than average water out there to be offset by cooler than average water near here.
In order to see drying effects in Australia, we need the map to show cool blues in our part of the tropics.
We already have cool blues off the northwest coast, but that blue needs to spread throughout Indonesia too. Each week the blue area on the map grows, but it's not quite all the way there yet.
We still have a lingering warm pool off the northeast coast. That hasn’t begun to turn cool blue yet, but the yellows are getting lighter with each week.
The rest of 2023
If the forecasts are correct, then for the rest of the year we are likely to see tropical moisture pushed away from Australia, in both the Pacific and Indian Oceans.. .a double whammy.
This is in stark contrast to the past three years, where both oceans were pushing tropical moisture towards Australia.
When the moisture is pushed away we have less of it available to feed our low pressure systems, resulting in less rain.
It doesn’t completely stop the feed, we can certainly still see the odd juicy weather system, but we’re likely to see less of them overall.
In action:
-
Cold fronts will pass through, delivering rain to the southern coastline and ranges, but the rain dries up as it heads inland
-
In spring and summer, troughs in QLD and NSW will be fed by less moisture, so the falls from showers and storms may be lighter overall
-
When slow moving lows develop, that used to bring widespread flooding rain, they have less moisture so there’s less rain
-
Those juicy northwest cloud bands of recent years are less juicy overall, resulting in less rain falling across southern AUS
-
With less rain, skies are clearer, and we are more susceptible to both frost and extreme heat.
See what conditions are most likely at your property, hour by hour for the next ten days, along with our customisable insights highlighting the impacts on your operations, with our precise and actionable forecasts at Jane’s Weather.
Sign up for alerts at Jane’s Weather below to stay ahead of what is on its way.
Our notifications include the weather summary, rain, winds and comfort, evapotranspiration, frost risk, growing degree days and weather conducive to pests and diseases, tailored to any property in Australia.
 Results

